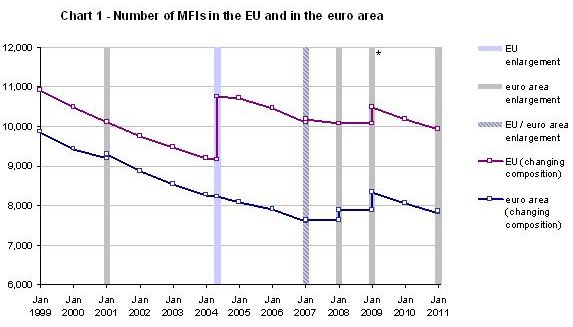
■ On 1 January 2011 there were 7,865 MFIs resident in the euro area, compared with 8,076 on 1 January 2010. In relative terms, the decrease in France and Greece of 7.1% and 6.7% respectively was particularly pronounced. In absolute terms, France (-92), Ireland (-31), Luxembourg (-28) and Italy (-25) were the main contributors to the net decrease of 211 units in the euro area.
■ Despite the enlargement of the euro area through the accession of Greece (2001), Slovenia (2007), Cyprus and Malta (both 2008), Slovakia (2009) and Estonia (2011), the number of MFIs in the euro area has decreased by 20.2% or 1,991 institutions since 1 January 1999. On 1 January 2011 Germany and France accounted for 40.8% of all euro area MFIs, a share similar to that recorded on 1 January 2010.
■ On 1 January 2011 there were 9,921 MFIs resident in the EU, a net decrease of 271 units (-2.7%) since 1 January 2010. Compared with the situation on 1 January 1999 (10,909 MFIs in the EU), there has been a net decrease of 988 units (-9.1%), despite the addition of 1,608 MFIs on 1 May 2004, when ten new Member States acceded, and of a further 72 MFIs on 1 January 2007, when Bulgaria and Romania joined the EU.

The increased number of MFIs on 1 January resulted mainly from a reclassification of institutions as MFIs in Ireland and in Spain, as well as from Slovakia joining the euro area.
Structure of the MFI population
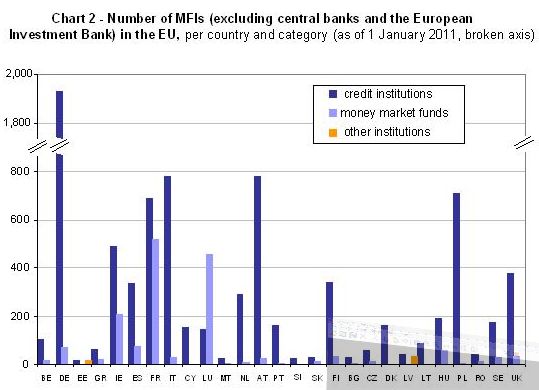
■ The vast majority of euro area MFIs are credit institutions (i.e. commercial banks, savings banks, post office banks, credit unions, etc.), which accounted for 80.8% of such institutions (6,352 units) on 1 January 2011, while money market funds represented 18.7% (1,474 units). Central banks (18 units including the ECB) and other institutions (21 units) together accounted for only 0.3% of all euro area MFIs.
■ In the EU as a whole, credit institutions accounted for 82.7% of MFIs on 1 January 2011, while money market funds represented 16.4% (see Chart 2 below).

Country breakdown on 1 January 2011
■ In the euro area, Germany and France accounted for 40.8% of all MFIs. Italy, Austria and Ireland accounted for a further 29.4%. Over the past 12 years (1999-2011) noteworthy developments in national MFI sectors included a significant increase of 600 units in Ireland over the period as a whole. At the same time there were relatively large falls of 55.1%, 39.1% and 37.8% respectively in the number of monetary institutions in the Netherlands, Germany and France and lesser declines of 32.1%, 28.1% and 19.6% in Spain, Portugal and Belgium.
■ Among the non-euro area EU Member States, Poland had the largest number of MFIs (710), representing 7.2% of the MFI sector in the EU, or 34.5% of MFIs in the non-euro area EU Member States. The United Kingdom (19.8%), Hungary (12%), Sweden (10%) and Denmark (8.0%) follow as main contributors to the number of MFIs in the non-euro area EU Member States. Between the beginning of 1999 and 1 January 2011, there was a considerable reduction in the number of MFIs in the United Kingdom and Denmark, by 26.8% and 24.1% respectively.
Foreign branches
■ On 1 January 2011 630 branches of non-domestic credit institutions were resident in the euro area. These branches accounted for 9.9% of all euro area credit institutions. The largest share of these branches was located in Germany (17.5%). Estonia (61.1%) and Belgium (54.7%) have the largest proportion of foreign branches in relation to the total number of credit institutions. The head offices of the majority of the foreign branches in euro area countries were located either in another euro area country (64.4%) or in the United Kingdom (14.6%).
■ On 1 January 2011 there were 263 branches of foreign credit institutions resident in non-euro area EU Member States. Of these, the largest proportion (51.7%) was located in the United Kingdom. The head offices of the majority of the foreign branches in non-euro area EU Member States were located either in euro area countries (52.5%) or in other non-euro area EU Member States (20.2%).


