The four-quarter cumulated data for goods and services up to the second quarter of 2010 revealed that EU countries excluding the United Kingdom represent the euro area’s primary trading partner, accounting for 17% of euro area exports of goods and services and 16% of euro area imports of goods and services, followed by the United Kingdom and the United States.
The international investment position as at end-2009
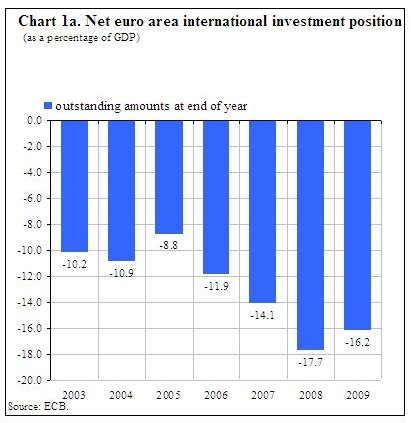
At the end of 2009, the international investment position (i.i.p.) of the euro area vis-à-vis the rest of the world recorded net liabilities of EUR 1.4 trillion (representing 16% of euro area GDP). This reflects a decrease of EUR 193 billion in net liabilities compared with the revised end-2008 position, which represented 18% of euro area GDP (see Chart 1a)

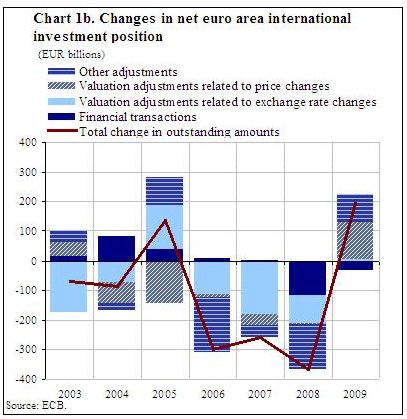
The decrease in the net liability position from end-2008 to end-2009 was mainly the result of positive revaluation effects due to price changes which were larger for assets than for liabilities (EUR 128 billion) and other adjustments (EUR 92 billion), which more than offset the increase in net liabilities due to financial transactions (EUR 31 billion). Revaluation effects due to exchange rate changes slightly decreased the net liability position by EUR 4 billion (see Chart 1b). The other adjustments in portfolio investment mainly reflected the change in residency of some investment funds from offshore financial centres to the euro area, and in reserve assets the IMF’s allocation of special drawing rights to euro area countries.
Compared with 2008, exchange rate changes in 2009 had a much smaller impact on the euro area’s net liability position. Net financial transactions and other adjustments also show less of an impact, while price changes had a much greater impact.
Net financial transactions were mainly driven by net purchases of euro area debt securities (EUR 261 billion) and euro area equity securities (EUR 83 billion) by non-residents, and were partly offset by net outflows in other investment. In particular, the net outflows for the Eurosystem (EUR 232 billion) were mainly related to the cancellation of the reciprocal currency arrangements (swap lines) between the European Central Bank (ECB) and central banks outside the euro area.
The i.i.p. revaluations reflecting price changes amounted to EUR 128 billion in net terms in 2009. These were mainly recorded in direct investment (EUR 93 billion), reflecting the fact that the price increases of non-euro area stock market indices were larger than those of the euro area. In addition, reserve assets reflected a price change of EUR 46 billion, mainly related to the gold price increase by 23%
The changes in outstanding amounts related to exchange rate variations reflected the diverse evolution of the euro in respect of other currencies in 2009 (e.g. its 3% appreciation against the US dollar and its 7% depreciation against the pound sterling). In 2009 changes in the i.i.p. related to exchange rate variations were mainly due to foreign currency revaluations of other investment (EUR 14 billion), partially offset by direct investment (EUR 6 billion) and reserve assets (EUR 3 billion).

The geographical breakdown of the international investment position as at end-2009
At the end of 2009 the stock of euro area direct investment abroad amounted to EUR 4.3 trillion, 23% of which was invested in the United Kingdom, 18% in the United States, 13% in offshore financial centres, 10% in Switzerland and 7% in other EU countries. The stock of foreign direct investment in the euro area amounted to EUR 3.5 trillion, 32% of which originated from the United Kingdom, 24% from the United States, 13% from offshore financial centres and 8% from Switzerland. Compared with 2008, the shares of the euro area’s main trading partners have remained almost unchanged. The United Kingdom continues to be the most important net investor in the euro area (EUR 125 billion).
With regard to portfolio investment, euro area holdings of foreign securities amounted to EUR 4.2 trillion at the end of 2009, which largely reflected holdings of securities issued in the United States (32% of the total), the United Kingdom (24%) and offshore financial centres (10%). Foreign holdings of euro area securities amounted to EUR 6.7 trillion at the end of 2009.
Turning to other investment, the outstanding amount of euro area holdings abroad (e.g. loans by euro area MFIs to non-residents or deposits by euro area residents with non-euro area MFIs) was EUR 4.9 trillion at the end of 2009, 38% of which was in the United Kingdom, 14% in the United States and 12% in offshore financial centres. Other investment in the euro area (e.g. non-residents’ deposits with euro area MFIs or loans to euro area residents by non-euro area MFIs) amounted to EUR 5.0 trillion at the end of 2009, of which the United Kingdom accounted for 39%, the United States for 16% and offshore financial centres for 12%.
The geographical breakdown of the four-quarter cumulated current account up to the second quarter of 2010
The four-quarter cumulated current account of the euro area up to the second quarter of 2010 showed a deficit of EUR 33.6 billion (around 0.4% of euro area GDP), compared with a deficit of EUR 122.7 billion a year earlier. The four current account subcomponents contributed to this development, particularly a shift in the goods account from a deficit of EUR 9.9 billion to a surplus of EUR 40.3 billion, and a decrease in the income deficit from EUR 45.2 billion to EUR 12.0 billion. The deficit in current transfers decreased from EUR 100.9 billion to EUR 98.5 billion, and the surplus in services increased from EUR 33.3 billion to EUR 36.5 billion. While the shift in the goods account was predominantly due to a decrease in the deficit with the group of “other countries” (from EUR 127.5 billion to EUR 79.2 billion), particularly with China (from EUR 107.5 billion to EUR 87.2 billion), the decrease in the income deficit mostly reflected declines in the deficits with the United Kingdom (from EUR 21.1 billion to EUR 7.3 billion) and Switzerland (from EUR 12.6 billion to EUR 6.4 billion).
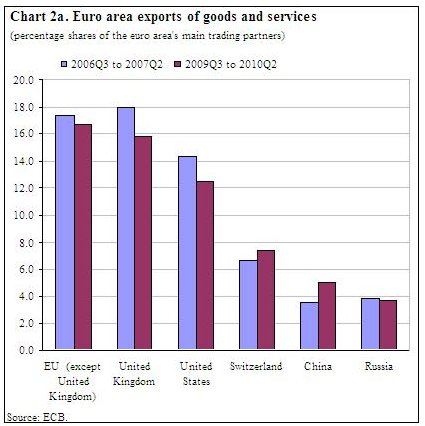
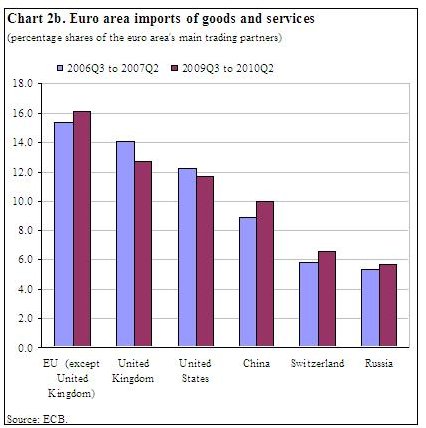
The four-quarter cumulated data up to the second quarter of 2010 revealed that EU countries excluding the United Kingdom represent the euro area’s primary trading partner, accounting for 17% of euro area exports of goods and services and 16% of euro area imports of goods and services, followed by the United Kingdom and the United States (See Charts 2a and 2b).


Data revisions
This press release incorporates a revised set of balance of payments (b.o.p.) and international investment position statistics since 2007.
The revisions for the current account in 2008 and 2009 concerned mainly income for direct investment and resulted in the current account deficit decreasing by EUR 19.9 billion (to EUR 133.9 billion) in 2008 and by EUR 6.2 billion (to EUR 49.8 billion) in 2009. Detailed results from companies’ balance sheets, which become available with some delay, showed that reinvested earnings were lower than initially estimated for foreign investment in the euro area and higher for euro area investment abroad.
In the b.o.p. financial account, revisions primarily affected net direct investment in 2008, portfolio investment liabilities and other investment assets. The main changes in portfolio investment consisted of higher net outflows for euro area debt instruments in 2007 and 2008 and for euro area equity securities in 2009; these revisions were mainly due to the introduction/refinement of systems to collect and compile portfolio investment data on a security-by-security basis, which have been in place in all euro area countries since 2009. The revisions for other investment are mainly related to other sectors.
In the i.i.p., the revisions from 2007 to 2008 resulted in an increase in the euro area net liability position. Finally, the euro area net liability position at end-2009 (EUR 1.4 trillion) has been revised upwards by EUR 59 billion, now standing higher than the figure published previously for the fourth quarter of 2009.


